Locality Mapping: An approach for creating a map information-resource for local residents in Barking and Dagenham for the Cost of Living Crisis
Kendrick Morris
The boroughs of Barking and Dagenham came together into a single jurisdiction in 1965 to become one of London’s 32 boroughs. There are 17 wards with 51 elected members all of whom are Labour Party members. The borough boomed between the wars, growing between 50 and 75 per cent per decade thanks to immigrants from inner-City London, attracted by new industry and good housing. The borough was hit by de-industrialisation and austerity, but population has continued to rise at more than 10 per cent per decade since 1990 and now stands at 218,000. The majority of residents are from minority ethnic groups, with Black people of African origin (16%) making up the largest single group. It is one of the most deprived boroughs in London, with nearly half of children living in poverty. A quarter of people live on low pay, twice as many as the richest boroughs. Infant mortality is also double the rate of the London borough with the lowest rate. This inequity and stress are reflected in health. On average, a woman in Barking and Dagenham will live just under five years less than a woman in Westminster. For men the gap is more than five years.[1]
In June 2022 and August 2022, there were two public Cost of Living Alliance summits to explore the ways to support the needs of residents impacted by the cost-of-living crisis. These summits provided updates on the work of the Cost of Living Alliance from a range of voluntary, community and social enterprises (VCSEs) and the Local Authority, and to see the analysis produced by the council's data insight team.
In October 2022 five local charities in Barking and Dagenham were funded by the local authority and the NHS, via the BDCollective (a network bringing the social sector of Barking & Dagenham together), to reach out into six localities across the borough with the aim to improve health, wellbeing and resilience through the cost of living crisis.[2]Together, they used maps to explore how social connections shape health and development in order to design better ways of living. The aim being to improve confidence, resilience and health through connection, trust and belonging. Each locality mapped out their social organisations, with locality leads contacting them to facilitate the needs of residents by:
Using two triage questions to open-up group discussions
To form resident design groups, and
Networking with local organisations
The vision is to encourage residents to look around locally from where they live, from street to street, to discover the social contacts and cost of living support around them and build their personal connections.

South East Locality
Using the example of the South East Locality, maps were used to highlight how the area has changed over time and which community spaces were helping residents through the cost of living crisis. The map allowed us to reach further into the community and discuss with residents their cost-of-living needs and support.
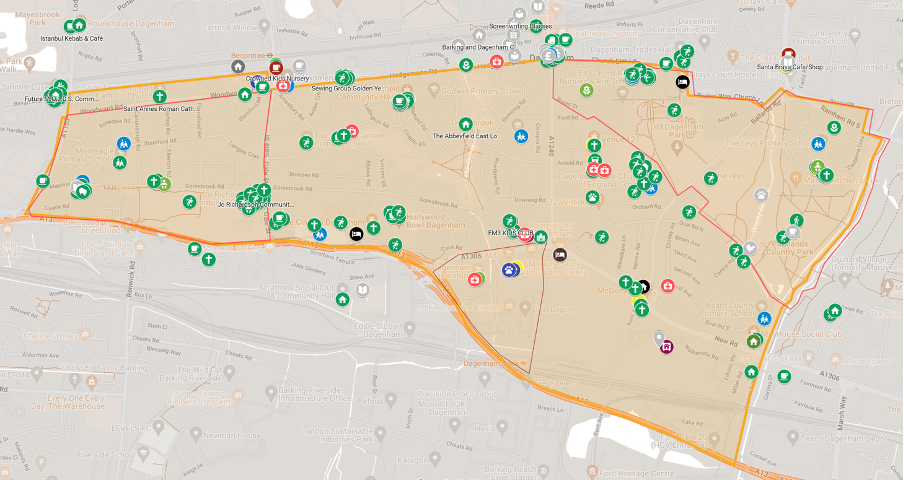
The maps show that 20 years ago there were 13 libraries in Barking and Dagenham, but today there are 6. The Woodward Road and Rectory Road libraries at the west and the east of the Locality South East, are no more. The council’s ‘Community Centres’ are leased by private ownership, and became halls for hire. Local social groups of informal coffee mornings no longer take place. These social-bonding groups, offered shared spaces for hobbies and interests, belonging and community building.
The maps were also used for residents to learn about community focused people and events. For instance, it was highlighted that the Pastor of a Pentecostal church (who also runs the Thereasa Greene Community Centre) with support from the locality lead, has started a free monthly community breakfast every first Saturday of the month. It was also noted that a Design Group was formed in the Dagenham Learning Centre (DLC) in Dagenham in February 2023, made up of local people concerned about the increased tensions in the Heathway. A cyclist reported being abused on the footpath and crime has increased. Original ideas were to put stickers on lampposts to affirm: ‘be kind’, and then to include a QR Code to link to a website with positive inspiring verses. They walked the Heathway to see where there was a sense of belonging and noted that the raised walls of a flower bed were the seating area that people often used, and that different churches evangelised at the Dagenham Heathway tube station entrance. They met with the shopkeepers to ask about the impact of the cost of living. And from this, a QR code for a map of local groups and support emerged. A sticker was put on local shop windows.
To view the map, click below:
Locality South East: A map to connect people for the cost of living crisis
Key to the Map
Groups that physically meet (in green) or online (in grey).
Food banks (in yellow)
Medical Centres (in red)
Author
Kendrick Morris
Locality Lead (South East)
Notes
[1] from the BDCollective in collaboration with Ratio, September 2023 report: Together We Lead? What happens when civil society comes together to solve social problems. https://bdcollective.co.uk/together-we-lead/
[2] The charities are: Al Medina Mosque, Disability Association Barking and Dagenham (DABD), Harmony House, Kingsley Hall, and Thames Life. Ratio (ratio.org.uk) provided the consultancy.